
While writing Into the Fishpond, a novel-length fan fiction story set in the “Fire Emblem: Three Houses” universe (FE3H), I built a growth model for tracking my readers’ engagement.
The story is long: forty-seven chapters, and over 200,000 words.
When I finished the initial story in August 2024, I copied my model and populated it with a fake/sample data set for other writers with a growth marketing mindset to use.
This post explains the model and my thinking, and contains a link to the Google Sheet for those who wish to apply it to their own projects.
Why I built a growth marketing AO3 stats model
In my day job, I’ve been the head of marketing for several tech companies and worked with many talented growth marketers. If you haven’t heard the term, it’s the field of marketing most concerned with how you grow and sustain a customer base.
Or, in this case, a group of engaged readers.
On whim, I started writing Fishpond on February 9, 2024. I didn’t know what I was doing or why, but I decided to post chapters beginning on February 22.
As a writer, I was completely new to AO3. I didn’t have any presence or following when I started. I had read some FE3H work by other writers dealing with this particular character pairing, but only as a guest. In the beginning, it felt like I was publishing the story for myself. I was skeptical that it would find readers.
Case in point about how little I knew — I didn’t discover the “Statistics” tab in the home screen until after I had published Chapter 14.
By mid-April, Fishpond had reached 1,000 hits. I told a growth marketing colleague what I was doing.
My colleague: “What’re you doing for Analytics?”
Me: “Not much. All the site data is in the moment. There’s no time-based record of the metrics at all.”
My colleague: “How about we fix that?”
We built out a Google Sheet to track what was happening with the story. My colleague also encouraged me to adopt a regular posting schedule given my steady output.
TL;DR — Get the E. M. Williams Growth Marketing AO3 Stats Model
My use case and assumptions
I started applying my data model when I published Chapter 17 of Fishpond on April 26, 2024. Thanks to back-and-forth texts with my colleague, I had some historical data from screenshots dating from my first weeks of publishing.
My numbers were and are limited to what appears on AO3’s summary page:
Beginning with Chapter 17, I posted twice a week on Monday and Thursday between 4 and 5:30 pm EST. That pattern continued until I reached Chapter 38. After that, my writing process got complicated. I needed more time between instalments.
By July, I’d switched to a weekly model (Thursdays) with Chapter 39. At this posting tempo, I saw significant growth between with each chapter. I’d now recommend going weekly or monthly, although it requires more patience.
True experiments, where marketers control everything except one variable to determine which option wins, are harder to do with fiction. The stories themselves vary. Knowing whether audiences are responding to the frequency or the content would be next-to-impossible to parse out (unless AO3 itself did a study).
As you’ll see, my AO3 Stats Model has two primary tabs:
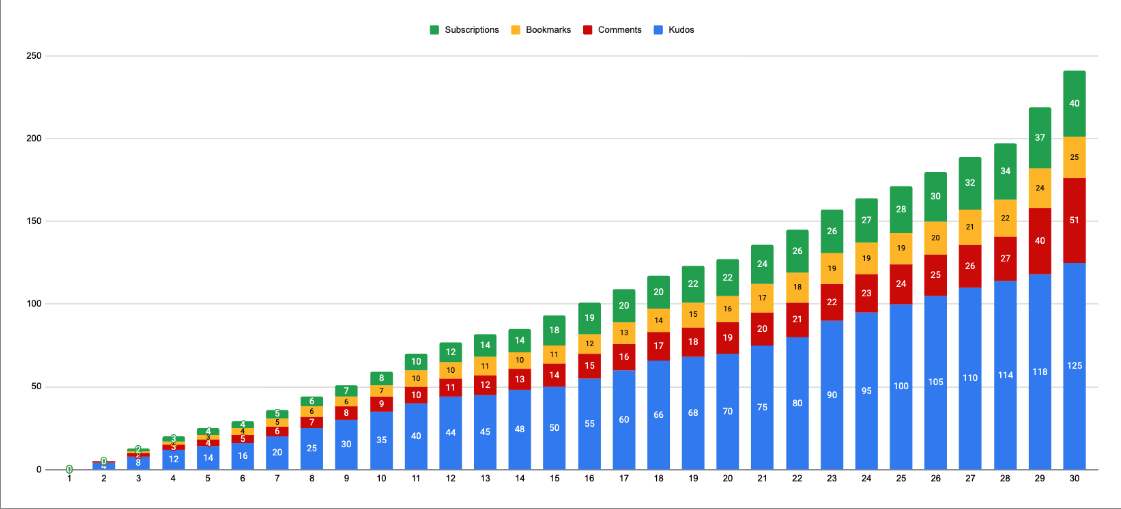
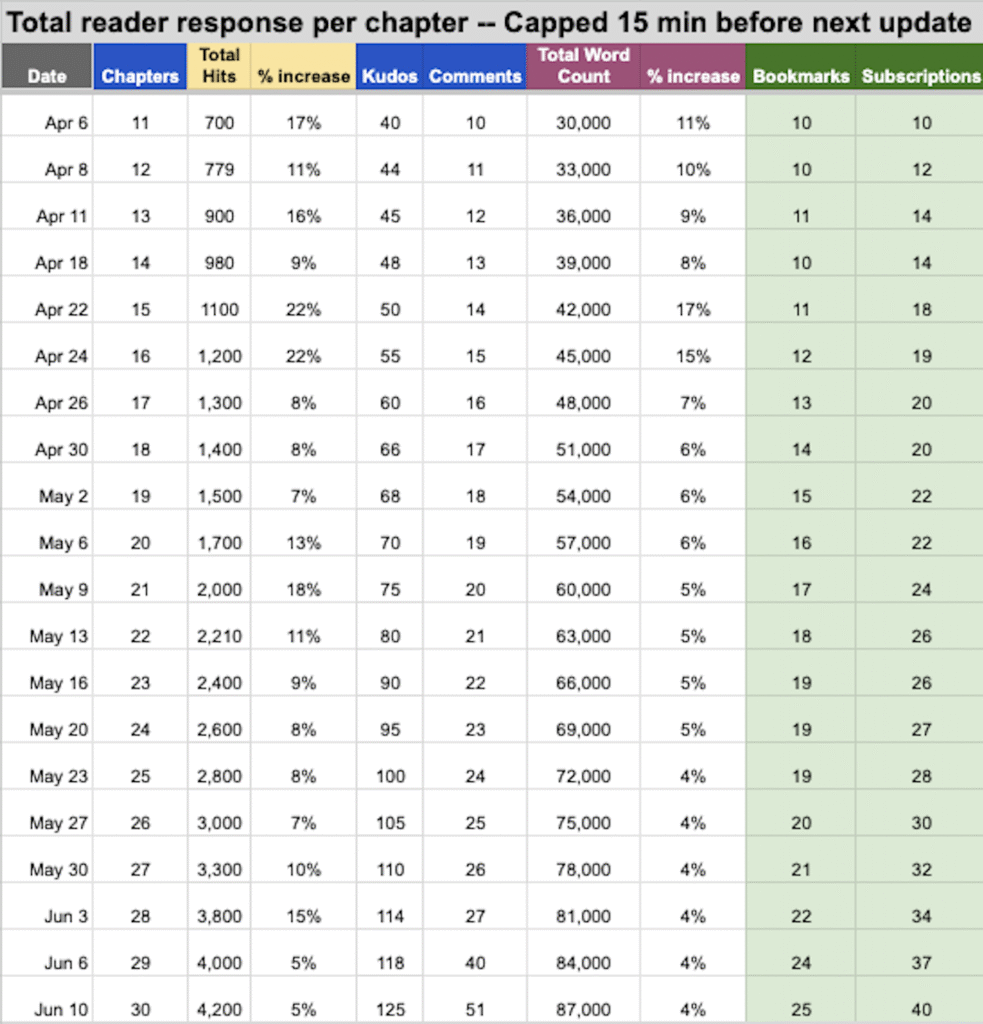
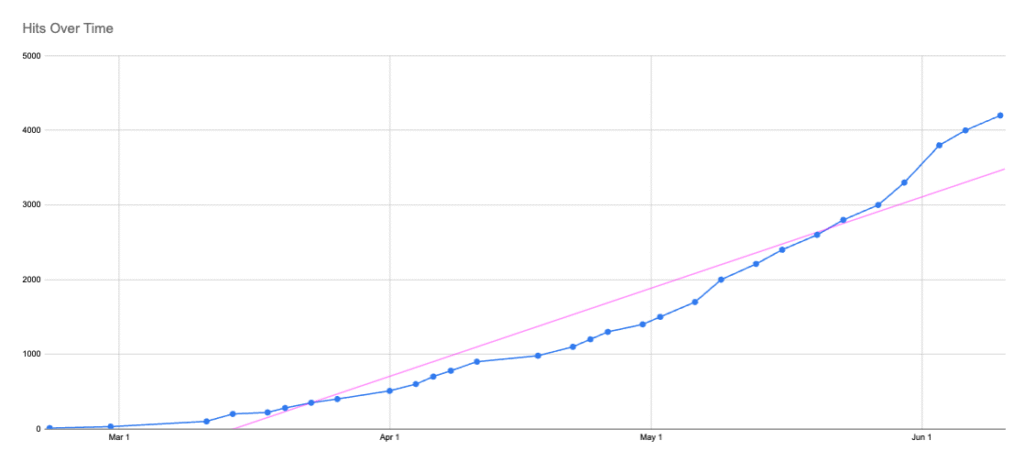
- General Growth by chapter, which tracks the baseline AO3 stats — I updated this sheet once a week in the 15 minutes before the next chapter went live. It contains a trend line that changes trajectory as you feed it more data, and a table for tracking overall audience engagement by chapter (kudos, comments, bookmarks and subscriptions).
- Chapter Growth by key metrics, which tracks activity within the first 24 hours and until the next chapter is published — I track hits, kudos and subscriptions (capped 15 minutes before publication).
You can’t beat email subscriptions for reach
Growth marketing focuses on actions that reduce friction between user and product. That’s why brands ask you to subscribe to their marketing newsletters when you buy something or to provide an email address before you see a demonstration.
Growth marketers love email because it partially solves the tug of war between social platforms building for self-serving needs and content creators trying to gain an audience. It’s a medium we control end-to-end.
AO3 is more like a library archive (with a beautiful tagging system) than it is like a social platform. It doesn’t have or need an algorithm with filtration power like you’d find on sites run by Meta or TikTok.
The subscription feature that AO3 provides is similar to email, but not the same. I can’t see the names addresses of anyone who subscribes; AO3 handles the actual emailing of updates I make.
But in principal, it’s close.
What I tracked
Hits are a key AO3 metric because they’re the way to know how many visits a work has had. Long-time AO3 users know the site counts a hit as one visit from an IP address within a 24-hour period. Multiple hits are not recorded, nor are hits from writers to their own work when logged in.
You can read more about how it works in the AO3 FAQ.
Kudos, the site’s equivalent to likes, indicate a work’s popularity and act as social proof that a story is engaging. Some writers particularly value them from registered accounts. Most platforms have a like/heart/Kudos function. I’m grateful to every single person who gave me one, whether from a registered user or a guest account.
Subscriptions, either to a work or to everything an AO3 writer publishes, mean readers get emailed every time you update. That makes a subscription the single most valuable metric to a growth marketer over time.
Why? Because the engagement action is a single click from your email inbox. As my subscriber count grew, so did the hit and kudos count week-to-week. I’m grateful to every reader who subscribed to the story or, eventually, to me.
My model only includes work subscriptions and not user subscriptions. When I started, I didn’t have any user subscriptions. You could adapt the model to track them separately or together as you see fit.
I can tell you that as Fishpond got more popular, I received double the subscriptions in the period 24 hours after a chapter published compared to the first 24 hours.
Why aren’t bookmarks tracked in Chapter Growth?
When a reader sets a bookmark, they still have to actively remember to check it to read the next piece of story, and some readers have dozens, if not hundreds or thousands, of bookmarks.
Readers can choose to make bookmarks private. That means the public-facing bookmark count on a story’s summary doesn’t give the whole picture.
I did love seeing my bookmark number rise; I tracked it in the General Growth tab. I also really love it when someone annotates their bookmark on my story — I can sometimes tell from the description how far they’ve read or which kind of reader they think story would appeal to.
But as growth stats go, it’s not as active or transparent an indicator of interest as a subscription.
Why aren’t comments tracked in Chapter Growth?
Comments are great. I love them.
From a growth perspective, their numbers are misleading, especially for works like mine. I responded to all my comments. That’s why I track them in the General Growth tab.
I respond to all of my comments because I enjoyed the interaction with the audience. They were a great source of qualitative feedback about whether the audience agreed with my instincts for the characters and plot — but I don’t count my comment responses in the model.
Given the number of people who never ever comment but will happily give a kudos, my colleague and I opted to give the kudos metric more weight.
For what it’s worth, I don’t think AO3 should count responses from creators on their own stories, either. Writers know we’re engaged in what’s happening with our work. I’d exclude them from the Dashboard counter.
Your mileage may vary and you can adapt your copy of the sheet how you like. Make it work for you!
If I could change one thing about AO3 stats . . .
I’d want to know how many users hit all the chapters in a work. Or, I’d ask for a ‘percentage read’ number or ‘completion rate’. Given how the Hit counter works, the number I see could easily be many, many people reading the first chapter and then stopping.
That’s why comments or annotated bookmarks are so nice when they crop up. It’s the only way to get a sense of how far people are reading. But I don’t believe they’re an accurate measure.
Growth marketers can be a bit obsessive
In general, growth marketers are data-driven people. We can be a bit (a lot?) obsessive about things we track.
Getting accurate numbers requires manual updates a couple times a week. I’m comfortable with that, but you may want to change it up.
If the sheet is too much, feel free to cut back for your copy, adapt it, or ignore it. Track whatever feels right for you.
My goal is to give you a tool, not an obligation.
Data trends take time to develop on any platform
If you’re new to any Internet platform, it takes a while for people interested in your content to find your work.
I saw a big inflection point for Fishpond in Chapter 16 and again in Chapter 27. When I moved to the weekly model, I again saw a big jump with Chapter 39.
My data and publishing frequency prior to Chapter 15 were erratic. If I’d decided then to pass judgement on whether the story was a success or failure, whatever answer I gave myself about what was happening would probably have been wrong.
It was simply too soon to know.
Be patient with your work. It takes time to find an audience and for people to get invested.
That’s the lesson I’m taking forward with The Xenthian Cycle.